Solutions
Solutions to Try Its
1. [latex]\left[-3,5\right][/latex] 2. [latex]\left(-\infty ,-2\right)\cup \left[3,\infty \right)[/latex] 3. [latex]x<1[/latex] 4. [latex]x\ge -5[/latex] 5. [latex]\left(2,\infty \right)[/latex] 6. [latex]\left[-\frac{3}{14},\infty \right)[/latex] 7. [latex]6<x\le 9\text{ }\text{ }\text{or}\left(6,9\right][/latex] 8. [latex]\left(-\frac{1}{8},\frac{1}{2}\right)[/latex] 9. [latex]|x - 2|\le 3[/latex] 10. [latex]k\le 1[/latex] or [latex]k\ge 7[/latex]; in interval notation, this would be [latex]\left(-\infty ,1\right]\cup \left[7,\infty \right)[/latex].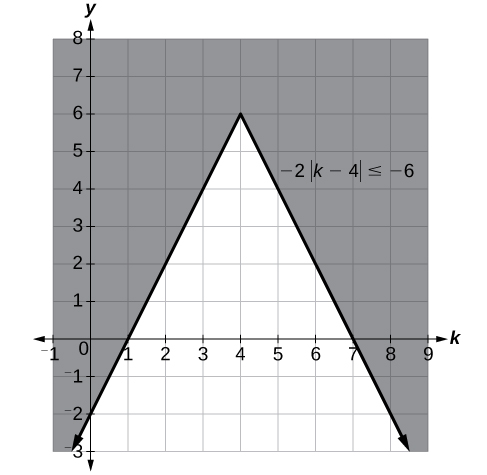
Solutions to Odd-Numbered Exercises
1. When we divide both sides by a negative it changes the sign of both sides so the sense of the inequality sign changes. 3. [latex]\left(-\infty ,\infty \right)[/latex] 5. We start by finding the x-intercept, or where the function = 0. Once we have that point, which is [latex]\left(3,0\right)[/latex], we graph to the right the straight line graph [latex]y=x - 3[/latex], and then when we draw it to the left we plot positive y values, taking the absolute value of them. 7. [latex]\left(-\infty ,\frac{3}{4}\right][/latex] 9. [latex]\left[\frac{-13}{2},\infty \right)[/latex] 11. [latex]\left(-\infty ,3\right)[/latex] 13. [latex]\left(-\infty ,-\frac{37}{3}\right][/latex] 15. All real numbers [latex]\left(-\infty ,\infty \right)[/latex] 17. [latex]\left(-\infty ,\frac{-10}{3}\right)\cup \left(4,\infty \right)[/latex] 19. [latex]\left(-\infty ,-4\right]\cup \left[8,+\infty \right)[/latex] 21. No solution 23. [latex]\left(-5,11\right)[/latex] 25. [latex]\left[6,12\right][/latex] 27. [latex]\left[-10,12\right][/latex] 29. [latex]\begin{array}{ll}x> -6\text{ and }x> -2\hfill & \text{Take the intersection of two sets}.\hfill \\ x>-2,\text{ }\left(-2,+\infty \right)\hfill & \hfill \end{array}[/latex] 31. [latex]\begin{array}{ll}x< -3\text{ }\mathrm{or}\text{ }x\ge 1\hfill & \text{Take the union of the two sets}.\hfill \\ \left(-\infty ,-3\right){\cup }\left[1,\infty \right)\hfill & \hfill \end{array}[/latex] 33. [latex]\left(-\infty ,-1\right)\cup \left(3,\infty \right)[/latex]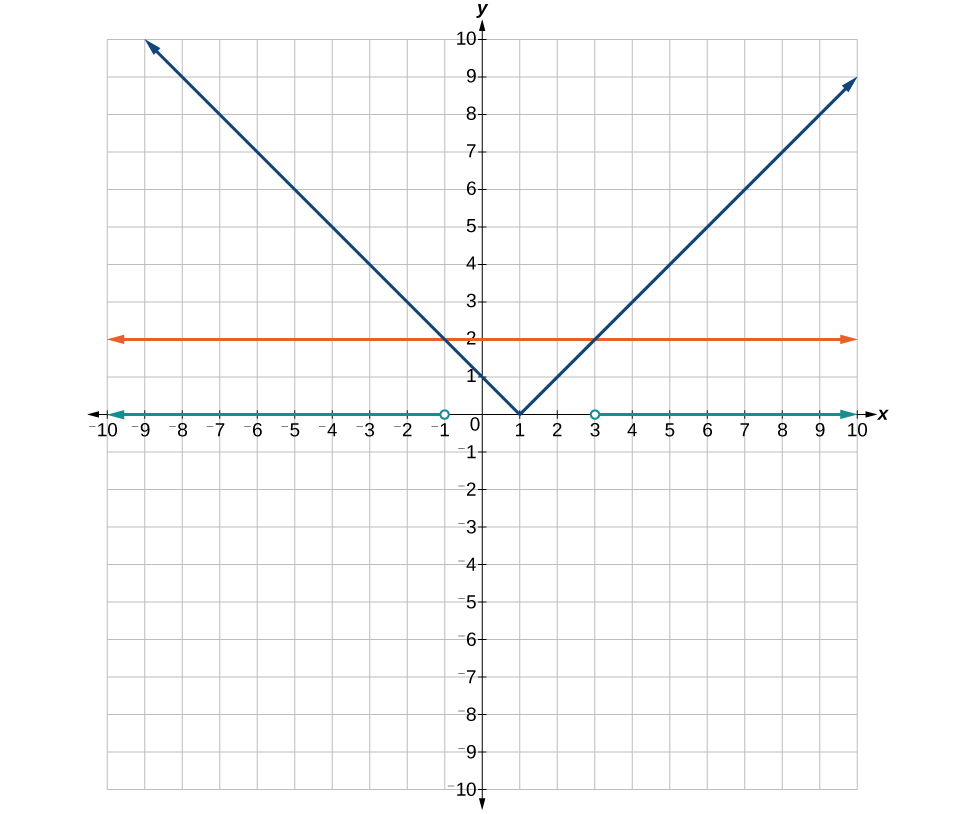 35. [latex]\left[-11,-3\right][/latex]
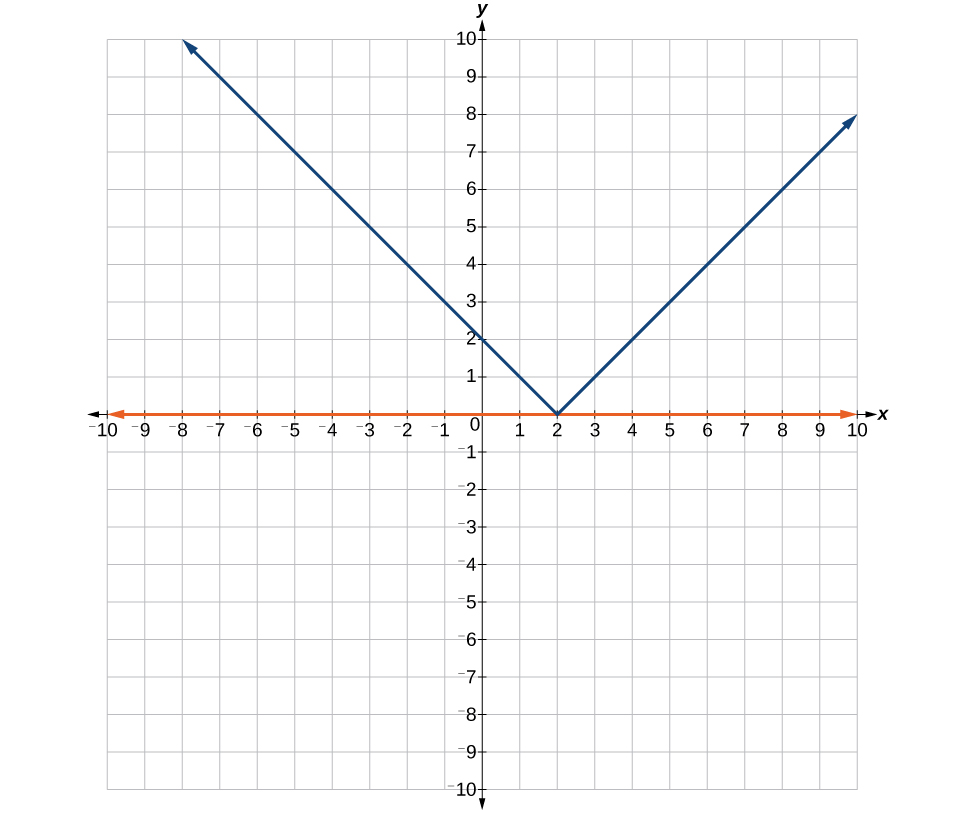
 37. It is never less than zero. No solution.
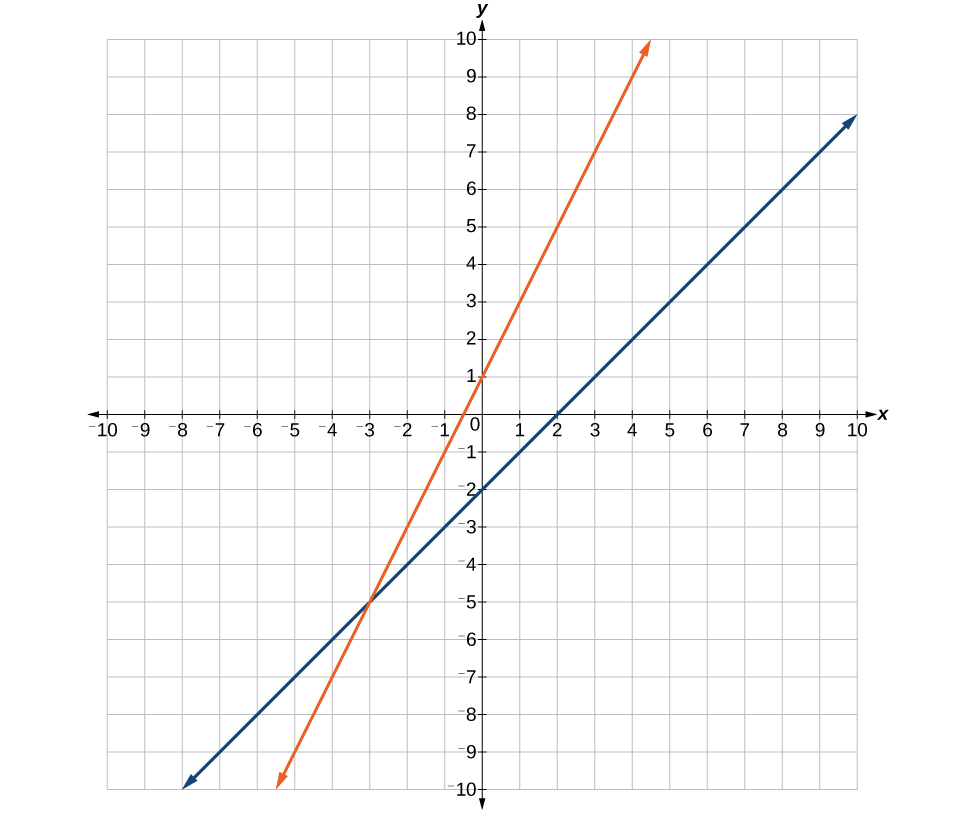
 39. Where the blue line is above the orange line; point of intersection is [latex]x=-3[/latex].
[latex-display]\left(-\infty ,-3\right)[/latex-display]
39. Where the blue line is above the orange line; point of intersection is [latex]x=-3[/latex].
[latex-display]\left(-\infty ,-3\right)[/latex-display]
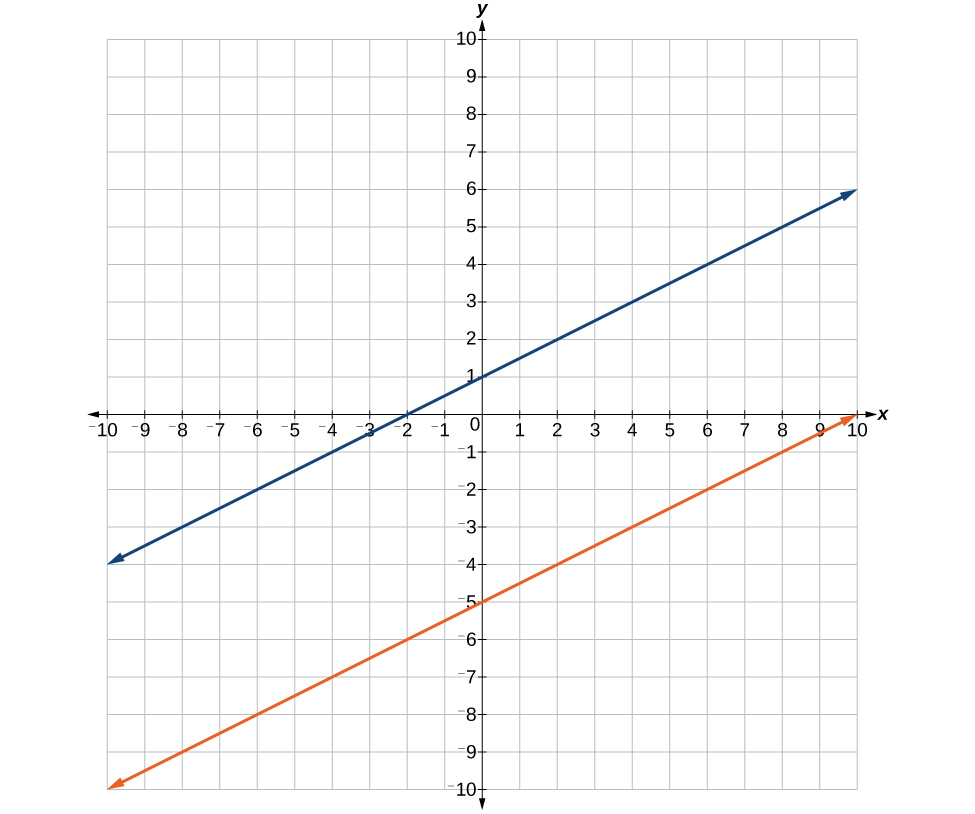
 41. Where the blue line is above the orange line; always. All real numbers.
[latex-display]\left(-\infty ,-\infty \right)[/latex-display]
41. Where the blue line is above the orange line; always. All real numbers.
[latex-display]\left(-\infty ,-\infty \right)[/latex-display]
 43. [latex]\left(-1,3\right)[/latex]
45. [latex]\left(-\infty ,4\right)[/latex]
47. [latex]\{x|x<6\}[/latex]
49. [latex]\{x|-3\le x<5\}[/latex]
51. [latex]\left(-2,1\right][/latex]
53. [latex]\left(-\infty ,4\right][/latex]
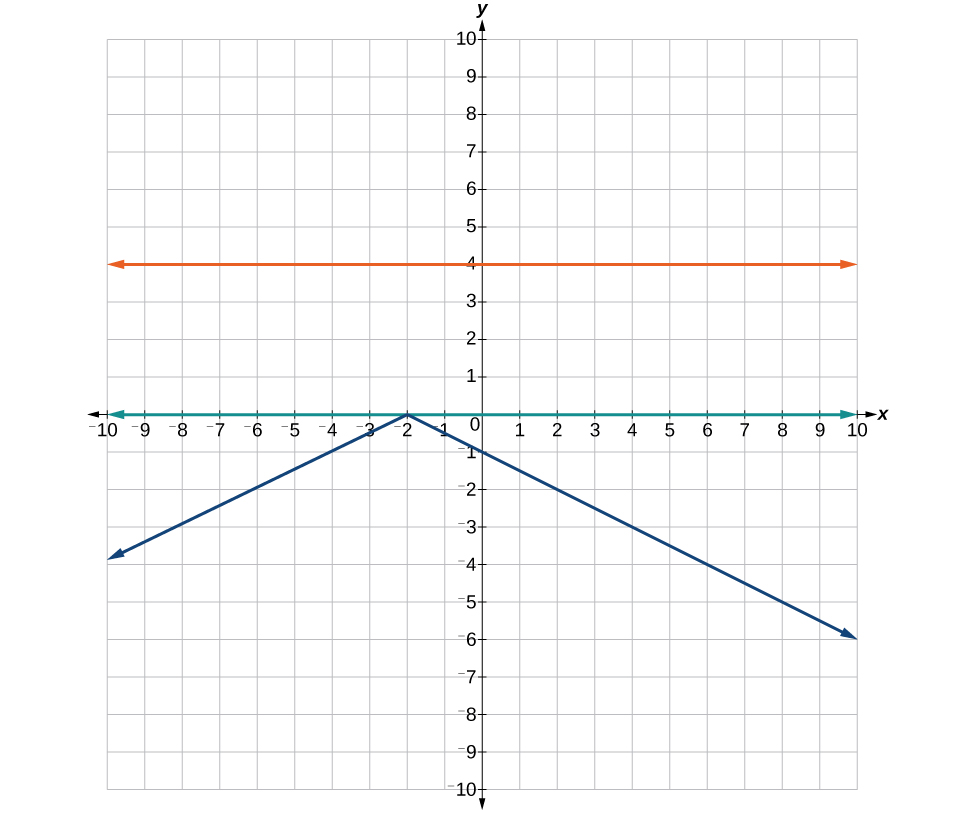
55. Where the blue is below the orange; always. All real numbers. [latex]\left(-\infty ,+\infty \right)[/latex].
43. [latex]\left(-1,3\right)[/latex]
45. [latex]\left(-\infty ,4\right)[/latex]
47. [latex]\{x|x<6\}[/latex]
49. [latex]\{x|-3\le x<5\}[/latex]
51. [latex]\left(-2,1\right][/latex]
53. [latex]\left(-\infty ,4\right][/latex]
55. Where the blue is below the orange; always. All real numbers. [latex]\left(-\infty ,+\infty \right)[/latex].
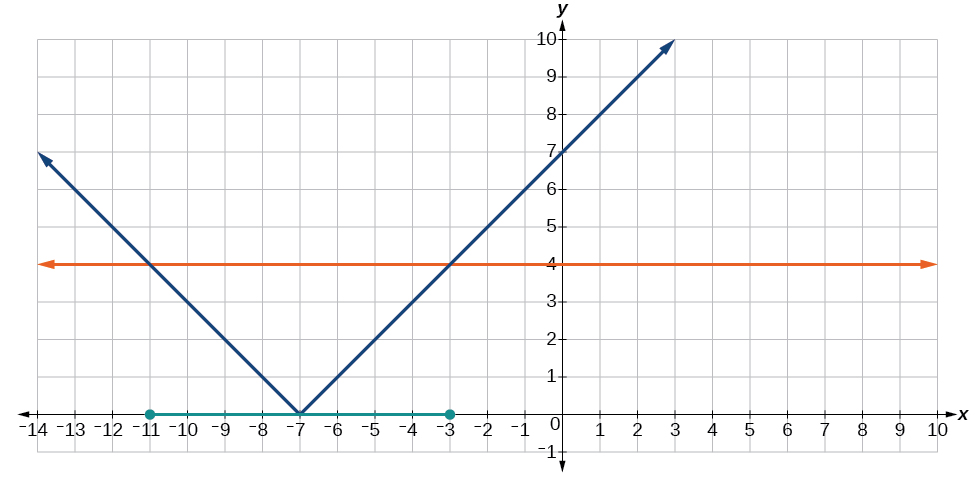
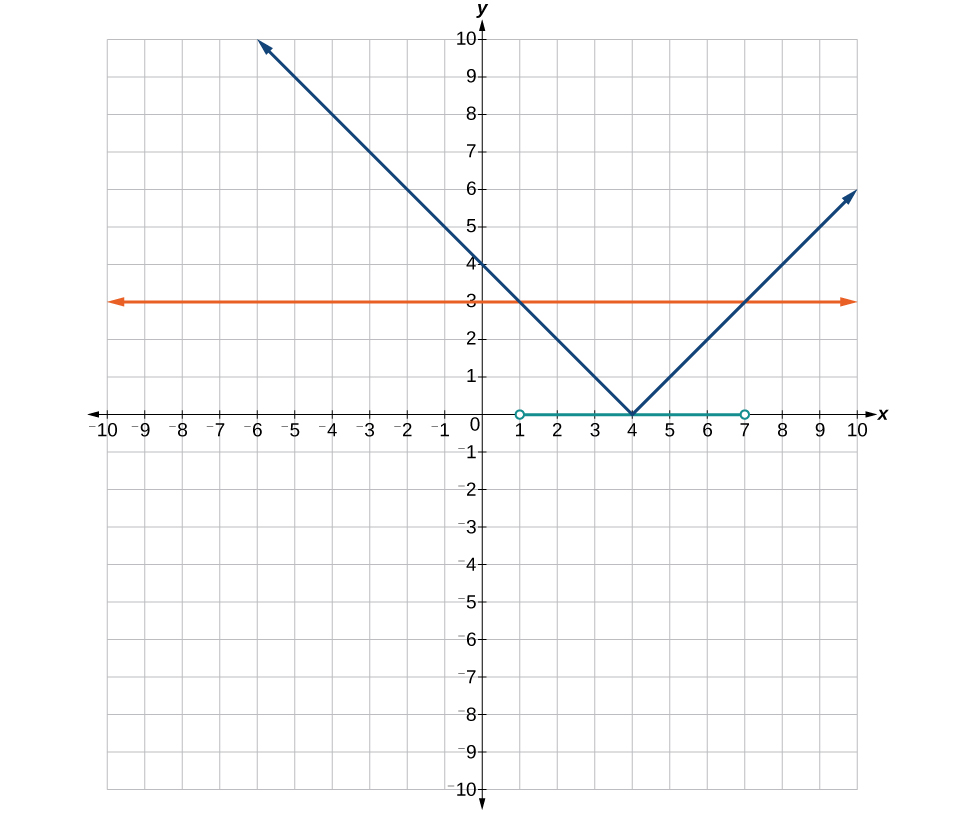
 57. Where the blue is below the orange; [latex]\left(1,7\right)[/latex].
 59. [latex]x=2,\frac{-4}{5}[/latex]
61. [latex]\left(-7,5\right][/latex]
63. [latex]\begin{array}{l}80\le T\le 120\\ 1,600\le 20T\le 2,400\end{array}[/latex]
[latex-display]\left[1,600, 2,400\right][/latex-display]
59. [latex]x=2,\frac{-4}{5}[/latex]
61. [latex]\left(-7,5\right][/latex]
63. [latex]\begin{array}{l}80\le T\le 120\\ 1,600\le 20T\le 2,400\end{array}[/latex]
[latex-display]\left[1,600, 2,400\right][/latex-display]Licenses & Attributions
CC licensed content, Specific attribution
- College Algebra. Provided by: OpenStax Authored by: OpenStax College Algebra. Located at: https://cnx.org/contents/[email protected]:1/Preface. License: CC BY: Attribution.
