Why It Matters: Function Basics
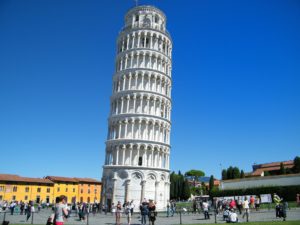 When Galileo was about 26 years old and working at the University of Pisa, he began considering the rates at which objects fall. Aristotle before him had predicted that the rate at which an object falls is dependent on its mass. In other words, a heavy object should fall faster than a lighter one. Galileo devised an experiment to test this idea. Perhaps you have heard the famous story of Galileo dropping two balls of different masses from the top of the leaning Tower Pisa.
There are two aspects of this story that are truly important. One is that controlled scientific experiments were simply not performed during his time. And quite frankly, the evidence is unclear as to whether he actually performed the experiment or just thought about the experiment based on observations on smaller scales, such as ramps. The story was recounted by one of Galileo’s students years after his death, but was never described by Galileo himself.
The other aspect is that Galileo’s conclusion, whether determined through experiment or thought, was that in the absence of air resistance all objects fall at the same rate regardless of mass. That rate is the acceleration due to gravity, which on Earth is 9.8 m/s2. This conclusion not only surprised Galileo and provided the first opposition to Aristotle’s theory, but forever changed our understanding of falling motion.
When Galileo was about 26 years old and working at the University of Pisa, he began considering the rates at which objects fall. Aristotle before him had predicted that the rate at which an object falls is dependent on its mass. In other words, a heavy object should fall faster than a lighter one. Galileo devised an experiment to test this idea. Perhaps you have heard the famous story of Galileo dropping two balls of different masses from the top of the leaning Tower Pisa.
There are two aspects of this story that are truly important. One is that controlled scientific experiments were simply not performed during his time. And quite frankly, the evidence is unclear as to whether he actually performed the experiment or just thought about the experiment based on observations on smaller scales, such as ramps. The story was recounted by one of Galileo’s students years after his death, but was never described by Galileo himself.
The other aspect is that Galileo’s conclusion, whether determined through experiment or thought, was that in the absence of air resistance all objects fall at the same rate regardless of mass. That rate is the acceleration due to gravity, which on Earth is 9.8 m/s2. This conclusion not only surprised Galileo and provided the first opposition to Aristotle’s theory, but forever changed our understanding of falling motion.
 Knowing that all objects fall at the same rate, you can predict both the velocity of an object and the distance it has fallen after some amount of time.
It turns out that the Tower of Pisa, at just over 55 meters, is a little too short for substantial experiments with falling bodies. But suppose Galileo were around today. He could actually perform his experiment by hanging out of a window in the tallest building in the world, the Burj Khalifa in Dubai, which stands 828 meters tall!
The table below lists the velocity and distance traveled by an object dropped from some height at 1 second time intervals.
Consider the following questions when analyzing the table below:
Knowing that all objects fall at the same rate, you can predict both the velocity of an object and the distance it has fallen after some amount of time.
It turns out that the Tower of Pisa, at just over 55 meters, is a little too short for substantial experiments with falling bodies. But suppose Galileo were around today. He could actually perform his experiment by hanging out of a window in the tallest building in the world, the Burj Khalifa in Dubai, which stands 828 meters tall!
The table below lists the velocity and distance traveled by an object dropped from some height at 1 second time intervals.
Consider the following questions when analyzing the table below:
- How are these values related to one another?
- How can you use them to make further predictions?
- What do they tell you about the motion of a falling object?
| Time (s) | 0 | 1 | 2 | 3 | 4 | 5 | 6 | 7 | 8 |
| Velocity (m/s) | 0 | 9.8 | 19.6 | 29.4 | 39.2 | 49.0 | 58.8 | 68.6 | 78.4 |
| Distance (m) | 0 | 4.9 | 19.6 | 44.1 | 78.4 | 122.5 | 176.4 | 240.1 | 313.6 |
Chart shows the correlation between time (seconds 1-8), velocity and distance.
In this module, you’ll find out how to answer these questions. It turns out that both velocity and distance can be described by functions. Read on to find out what a function is, how a function can be described, and what you can do to evaluate a function.Learning Objectives
Characteristics of Functions and Their Graphs- Determine whether a relation represents a function.
- Find the value of a function.
- Determine whether a function is one-to-one.
- Use the vertical line test to identify functions.
- Graph the functions listed in the library of functions
Domain and Range of Functions
- Find the domain of a function defined by an equation
- Write Domain and Range Using Standard Notations
- Find Domain and Range from a Graph
- Define Domain and Range of Toolkit Functions
- Graph Piecewise-Defined Functions
Rates of Change and Behavior of Graphs
- Find the average rate of change of a function.
- Use a graph to determine where a function is increasing, decreasing, or constant.
- Use a graph to locate local maxima and local minima.
- Use a graph to locate the absolute maximum and absolute minimum.
Licenses & Attributions
CC licensed content, Original
- Why It Matters: Function Basics. Authored by: Lumen Learning. License: CC BY: Attribution.
CC licensed content, Shared previously
- Leaning Tower of Pisa. License: CC BY: Attribution.
- Dubai Tower. License: CC BY: Attribution.
