Fractals Generated by Complex Numbers
You may be familiar with the fractal in the image below. The boundary of this shape exhibits quasi-self-similarity, in that portions look very similar to the whole. This object is called the Mandelbrot set and is generated by iterating a simple recursive rule using complex numbers.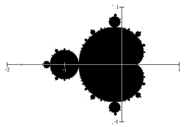 In this lesson, you will first learn about the arithmetic of complex numbers so you can understand how a fractal like the Mandelbrot set is generated.
Learning Objectives
The learning objectives for this lesson include:- Identify the difference between an imaginary number and a complex number
- Identify the real and imaginary parts of a complex number
- Plot a complex number on the complex plane
- Perform arithmetic operations on complex numbers
- Graph physical representations of arithmetic operations on complex numbers as scaling or rotation
- Generate several terms of a recursive relation
- Determine whether a complex number is part of the set of numbers that make up the Mandelbrot set
Arithmetic with Complex Numbers
[footnote]Portions of this section are remixed from Precalculus: An Investigation of Functions by David Lippman and Melonie Rasmussen. CC-BY-SA[/footnote] The numbers you are most familiar with are called real numbers. These include numbers like 4, 275, -200, 10.7, ½, π, and so forth. All these real numbers can be plotted on a number line. For example, if we wanted to show the number 3, we plot a point: To solve certain problems like [latex]x^{2}=–4[/latex], it became necessary to introduce imaginary numbers.Imaginary Number i
The imaginary number i is defined to be [latex]i=\sqrt{-1}[/latex]. Any real multiple of i, like 5i, is also an imaginary number.Example
Simplify [latex]\sqrt{-9}[/latex]. We can separate [latex]\sqrt{-9}[/latex] as [latex]\sqrt{9}\sqrt{-1}[/latex]. We can take the square root of 9, and write the square root of [latex]-1[/latex] as i.[latex]\sqrt{-9}=\sqrt{9}\sqrt{-1}=3i[/latex]
Complex Number
A complex number is a number [latex]z=a+bi[/latex], where- a and b are real numbers
- a is the real part of the complex number
- b is the imaginary part of the complex number
Complex Plane
In the complex plane, the horizontal axis is the real axis and the vertical axis is the imaginary axis.
Example
Plot the number [latex]3-4i[/latex] on the complex plane. The real part of this number is 3, and the imaginary part is [latex]-4[/latex]. To plot this, we draw a point 3 units to the right of the origin in the horizontal direction and 4 units down in the vertical direction.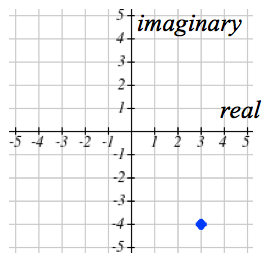
Try It Now
Example
Visualize the addition [latex]3-4i[/latex] and [latex]-1+5i[/latex]. The initial point is [latex]3-4i[/latex]. When we add [latex]-1+3i[/latex], we add [latex]-1[/latex] to the real part, moving the point 1 units to the left, and we add 5 to the imaginary part, moving the point 5 units vertically. This shifts the point [latex]3-4i[/latex] to [latex]2+1i[/latex].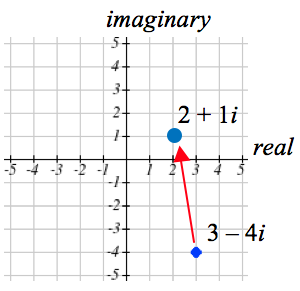
Try It Now
Example
Visualize the product [latex]2(1+2i)[/latex]. Multiplying we’d get[latex]\begin{align}&2\cdot1+2\cdot2i\\&=2+4i\\\end{align}[/latex]
Notice both the real and imaginary parts have been scaled by 2. Visually, this will stretch the point outwards, away from the origin.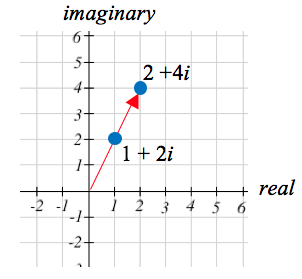
Example
Visualize the product [latex]i\left(l+2i\right)[/latex]. Multiplying, we’d get[latex]\begin{align}&i\cdot1+i\cdot2i\\&=i+2{{i}^{2}}\\&=i+2(-1)\\&=-2+i\\\end{align}[/latex]
In this case, the distance from the origin has not changed, but the point has been rotated about the origin, 90° counter-clockwise.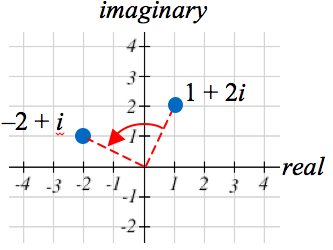
Try It Now
Multiply [latex]3-4i[/latex] and [latex]2+3i[/latex].Answer: Multiply [latex](3-4i)(2+3i)=6+9i-8i-12{{i}^{2}}=6+i-12(-1)=18+i[/latex]
Generating Fractals with Complex Numbers
Complex Recursive Sequences
Some fractals are generated with complex numbers. The Mandlebrot set, which we introduced briefly at the beginning of this module, is generated using complex numbers with a recursive sequence. Before we can see how to generate the Mandelbrot set, we need to understand what a recursive sequence is.Recursive Sequence
A recursive relationship is a formula which relates the next value, [latex]{{z}_{n+1}}[/latex], in a sequence to the previous value, [latex]{{z}_{n}}[/latex]. In addition to the formula, we need an initial value, [latex]{{z}_{0}}[/latex].Example
Given the recursive relationship [latex]{{z}_{n+1}}={{z}_{n}}+2,\quad{{z}_{0}}=4[/latex], generate several terms of the recursive sequence. We are given the starting value, [latex]{{z}_{0}}=4[/latex]. The recursive formula holds for any value of n, so if [latex]n = 0[/latex], then [latex]{{z}_{n+1}}={{z}_{n}}+2[/latex] would tell us [latex]{{z}_{0+1}}={{z}_{0}}+2[/latex], or more simply, [latex]{{z}_{1}}={{z}_{0}}+2[/latex]. Notice this defines [latex]{{z}_{1}}[/latex] in terms of the known [latex]{{z}_{0}}[/latex], so we can compute the value:[latex]{{z}_{1}}={{z}_{0}}+2=4+2=6[/latex].
Now letting [latex]n = 1[/latex], the formula tells us [latex]{{z}_{1+1}}={{z}_{1}}+2[/latex], or [latex]{{z}_{2}}={{z}_{1}}+2[/latex]. Again, the formula gives the next value in the sequence in terms of the previous value.[latex]{{z}_{2}}={{z}_{1}}+2=6+2=8[/latex]
Continuing,[latex]{{z}_{3}}={{z}_{2}}+2=8+2=10\\{{z}_{4}}={{z}_{3}}+2=10+2=12[/latex]
Try It Now
Mandelbrot Set
The Mandelbrot Set is a set of numbers defined based on recursive sequences.Mandelbrot Set
For any complex number c, define the sequence [latex]{{z}_{n+1}}={{z}_{n}}^{2}+c,\quad{{z}_{0}}=0[/latex] If this sequence always stays close to the origin (within 2 units), then the number c is part of the Mandelbrot Set. If the sequence gets far from the origin, then the number c is not part of the set.Example
Determine if [latex]c=1+i[/latex] is part of the Mandelbrot set. We start with [latex]{{z}_{0}}=0[/latex]. We continue, omitting some detail of the calculations[latex]{{z}_{1}}={{z}_{0}}^{2}+1+i=0+1+i=1+i\\{{z}_{2}}={{z}_{1}}^{2}+1+i={{(1+i)}^{2}}+1+i=1+3i\\{{z}_{3}}={{z}_{2}}^{2}+1+i={{(1+3i)}^{2}}+1+i=-7+7i\\{{z}_{4}}={{z}_{3}}^{2}+1+i={{(-7+7i)}^{2}}+1+i=1-97i[/latex]
We can already see that these values are getting quite large. It does not appear that [latex]c=1+i[/latex] is part of the Mandelbrot set.Example
Determine if [latex]c=0.5i[/latex] is part of the Mandelbrot set. We start with [latex]{{z}_{0}}=0[/latex]. We continue, omitting some detail of the calculations[latex]{{z}_{1}}={{z}_{0}}^{2}+0.5i=0+0.5i=0.5i\\{{z}_{2}}={{z}_{1}}^{2}+0.5i={{(0.5i)}^{2}}+0.5i=-0.25+0.5i\\{{z}_{3}}={{z}_{2}}^{2}+0.5i={{(-0.25+0.5i)}^{2}}+0.5i=-0.1875+0.25i\\{{z}_{4}}={{z}_{3}}^{2}+0.5i={{(-0.1875+0.25i)}^{2}}+0.5i=-0.02734+0.40625i[/latex]
While not definitive with this few iterations, it does appear that this value is remaining small, suggesting that 0.5i is part of the Mandelbrot set.Try It Now
Determine if [latex]c=0.4+0.3i[/latex] is part of the Mandelbrot set.Answer: [latex-display]{{z}_{1}}={{z}_{0}}^{2}+0.4+0.3i=0+0.4+0.3i=0.4+0.3i\\{{z}_{2}}={{z}_{1}}^{2}+0.4+0.3i={{(0.4+0.3i)}^{2}}+0.4+0.3i\\{{z}_{3}}={{z}_{2}}^{2}+0.5i={{(-0.25+0.5i)}^{2}}+0.5i=-0.1875+0.25i\\{{z}_{4}}={{z}_{3}}^{2}+0.5i={{(-0.1875+0.25i)}^{2}}+0.5i=-0.02734+0.40625i[/latex-display]
If all complex numbers are tested, and we plot each number that is in the Mandelbrot set on the complex plane, we obtain the shape to the right.[footnote]http://en.wikipedia.org/wiki/File:Mandelset_hires.png[/footnote]
The boundary of this shape exhibits quasi-self-similarity, in that portions look very similar to the whole.
Watch the following video for more examples of how to determine whether a complex number is a member of the Mandelbrot set.
https://youtu.be/ORqk5jAFpWg
In addition to coloring the Mandelbrot set itself black, it is common to the color the points in the complex plane surrounding the set. To create a meaningful coloring, often people count the number of iterations of the recursive sequence that are required for a point to get further than 2 units away from the origin. For example, using [latex]c=1+i [/latex] above, the sequence was distance 2 from the origin after only two recursions.
For some other numbers, it may take tens or hundreds of iterations for the sequence to get far from the origin. Numbers that get big fast are colored one shade, while colors that are slow to grow are colored another shade. For example, in the image below[footnote]This series was generated using Scott’s Mandelbrot Set Explorer[/footnote], light blue is used for numbers that get large quickly, while darker shades are used for numbers that grow more slowly. Greens, reds, and purples can be seen when we zoom in—those are used for numbers that grow very slowly.
The Mandelbrot set, for having such a simple definition, exhibits immense complexity. Zooming in on other portions of the set yields fascinating swirling shapes.
Additional Resources
A much more extensive coverage of fractals can be found on the Fractal Geometry site. This site includes links to several Java software programs for exploring fractals. If you are impressed with the Mandelbrot set, check out this TED talk from 2010 given by Benoit Mandelbrot on fractals and the art of roughness.Licenses & Attributions
CC licensed content, Original
- Revision and Adaptation. Provided by: Lumen Learning License: CC BY: Attribution.
- Question ID 131223, 131218. Authored by: Lumen Learning. License: CC BY: Attribution.
CC licensed content, Shared previously
- Math in Society. Authored by: Lippman, David. Located at: http://www.opentextbookstore.com/mathinsociety/. License: CC BY-SA: Attribution-ShareAlike.
- Complex arithmetic. Authored by: OCLPhase2. License: CC BY: Attribution.
- Visualizing complex arithmetic. Authored by: OCLPhase2. License: CC BY: Attribution.
- Question 1418. Authored by: WebWork Rochester. License: CC BY: Attribution.
- Recursive complex sequences. Authored by: OCLPhase2. License: CC BY: Attribution.
- Mandelbrot sequences. Authored by: OCLPhase2. License: CC BY: Attribution.
- Visualizing mandelbrot sequences and set . Authored by: OCLPhase2. License: CC BY: Attribution.
