Piecewise Linear Functions*
−x−3[/latex], erasing the part where x is greater than -3. Place an open circle at (-3,0).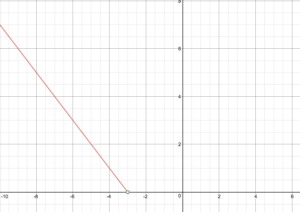 Now place the line [latex]f(x) = x+3[/latex] on the graph, starting at the point (-3,0). Note that for this portion of the graph, the point (-3,0) is included, so you can remove the open circle.
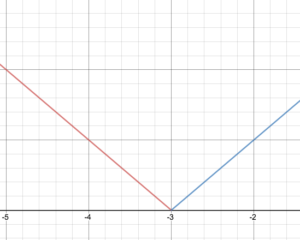 The two graphs meet at the point (-3,0)
The domain of this function is all real numbers because (-3,0)is not included as the endpoint of [latex]f(x) = −x−3[/latex], but it is included as the endpoint for [latex]f(x) = x+3[/latex].
The range of this function starts at [latex]f(x)=0[/latex] and includes 0, and goes to infinity, so we would write this as [latex]x\ge0[/latex][/hidden-answer]
In the next example, we will graph a piecewise defined function that models the cost of shipping for an online comic book retailer.
The two graphs meet at the point (-3,0)
The domain of this function is all real numbers because (-3,0)is not included as the endpoint of [latex]f(x) = −x−3[/latex], but it is included as the endpoint for [latex]f(x) = x+3[/latex].
The range of this function starts at [latex]f(x)=0[/latex] and includes 0, and goes to infinity, so we would write this as [latex]x\ge0[/latex][/hidden-answer]
In the next example, we will graph a piecewise defined function that models the cost of shipping for an online comic book retailer.
Example
An on-line comic book retailer charges shipping costs according to the following formula [latex]S(n)=\begin{cases}1.5n+2.5\text{ if }1\le{n}\le14\\0\text{ if }n\ge15\end{cases}[/latex] Draw a graph of the cost function.Answer: First, draw the line [latex]S(n)=1.5n+2.5[/latex]. We can use transformations: this is a vertical stretch of the identity by a factor of 1.5, and a vertical shift by 2.5.
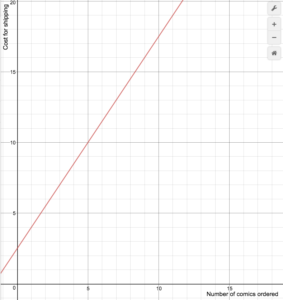 S(n)=1.5n+2.5
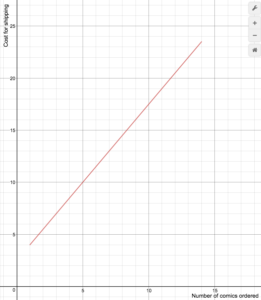 S(n) = 1.5n+2.5 for 1=n=14
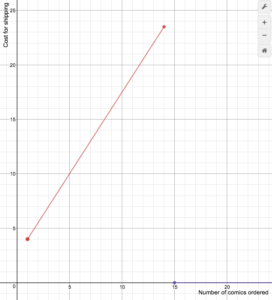
Summary
- A piecewise function is a function in which more than one formula is used to define the output over different pieces of the domain.
- Evaluating a piecewise function means you need to pay close attention to the correct expression used for the given input
Licenses & Attributions
CC licensed content, Original
- Revision and Adaptation. Provided by: Lumen Learning License: CC BY: Attribution.
- Determine a Basic Piecewise Defined Function. Authored by: James Sousa (Mathispower4u.com) for Lumen Learning. License: CC BY: Attribution.
CC licensed content, Shared previously
- Ex: Determine Function Values for a Piecewise Defined Function. Authored by: James Sousa (Mathispower4u.com) . License: CC BY: Attribution.
- College Algebra, Unit 1.4 Function Notation. Authored by: Carl Stitz and Jeff Zeager. Located at: https://www.stitz-zeager.com/szca07042013.pdf. License: CC BY: Attribution.
- Ex 2: Graph a Piecewise Defined Function. Authored by: James Sousa (Mathispower4u.com) . License: CC BY: Attribution.
CC licensed content, Specific attribution
- Precalculus. Provided by: OpenStax Authored by: Jay Abramson, et al.. Located at: https://openstax.org/books/precalculus/pages/1-introduction-to-functions. License: CC BY: Attribution. License terms: Download For Free at : http://cnx.org/contents/[email protected]..
