Reading: Equilibrium—Where Demand and Supply Intersect
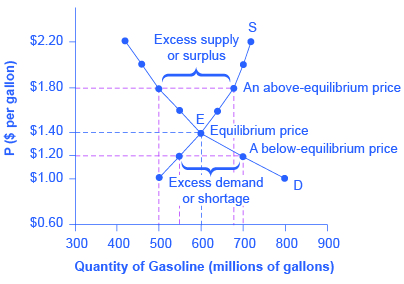
Because the graphs for demand and supply curves both have price on the vertical axis and quantity on the horizontal axis, the demand curve and supply curve for a particular good or service can appear on the same graph. Together, demand and supply determine the price and the quantity that will be bought and sold in a market. Figure 3 illustrates the interaction of demand and supply in the market for gasoline. The demand curve (D) is identical to Figure 1. The supply curve (S) is identical to Figure 2. Table 3 contains the same information in tabular form. Figure 3. Demand and Supply for Gasoline. The demand curve (D) and the supply curve (S) intersect at the equilibrium point E, with a price of $1.40 and a quantity of 600. The equilibrium is the only price where quantity demanded is equal to quantity supplied. At a price above equilibrium like $1.80, quantity supplied exceeds the quantity demanded, so there is excess supply. At a price below equilibrium such as $1.20, quantity demanded exceeds quantity supplied, so there is excess demand.Price, Quantity Demanded, and Quantity Supplied
| Table 3 | ||
| Price (per gallon) | Quantity demanded (millions of gallons) | Quantity supplied (millions of gallons) |
|---|---|---|
| $1.00 | 800 | 500 |
| $1.20 | 700 | 550 |
| $1.40 | 600 | 600 |
| $1.60 | 550 | 640 |
| $1.80 | 500 | 680 |
| $2.00 | 460 | 700 |
| $2.20 | 420 | 720 |
Key Concepts and Summary
A demand schedule is a table that shows the quantity demanded at different prices in the market. A demand curve shows the relationship between quantity demanded and price in a given market on a graph. The law of demand states that a higher price typically leads to a lower quantity demanded. A supply schedule is a table that shows the quantity supplied at different prices in the market. A supply curve shows the relationship between quantity supplied and price on a graph. The law of supply says that a higher price typically leads to a higher quantity supplied. The equilibrium price and equilibrium quantity occur where the supply and demand curves cross. The equilibrium occurs where the quantity demanded is equal to the quantity supplied. If the price is below the equilibrium level, then the quantity demanded will exceed the quantity supplied. Excess demand or a shortage will exist. If the price is above the equilibrium level, then the quantity supplied will exceed the quantity demanded. Excess supply or a surplus will exist. In either case, economic pressures will push the price toward the equilibrium level.OpenStax, Microeconomics, " Demand, Supply, and Equilibrium in Markets for Goods and Services," licensed under a CC BY 3.0 license.
