Graphing Equations by Plotting Points
We can plot a set of points to represent an equation. When such an equation contains both an x variable and a y variable, it is called an equation in two variables. Its graph is called a graph in two variables. Any graph on a two-dimensional plane is a graph in two variables. Suppose we want to graph the equation [latex]y=2x - 1[/latex]. We can begin by substituting a value for x into the equation and determining the resulting value of y. Each pair of x- and y-values is an ordered pair that can be plotted. The table below lists values of x from –3 to 3 and the resulting values for y.| [latex]x[/latex] | [latex]y=2x - 1[/latex] | [latex]\left(x,y\right)[/latex] |
| [latex]-3[/latex] | [latex]y=2\left(-3\right)-1=-7[/latex] | [latex]\left(-3,-7\right)[/latex] |
| [latex]-2[/latex] | [latex]y=2\left(-2\right)-1=-5[/latex] | [latex]\left(-2,-5\right)[/latex] |
| [latex]-1[/latex] | [latex]y=2\left(-1\right)-1=-3[/latex] | [latex]\left(-1,-3\right)[/latex] |
| [latex]0[/latex] | [latex]y=2\left(0\right)-1=-1[/latex] | [latex]\left(0,-1\right)[/latex] |
| [latex]1[/latex] | [latex]y=2\left(1\right)-1=1[/latex] | [latex]\left(1,1\right)[/latex] |
| [latex]2[/latex] | [latex]y=2\left(2\right)-1=3[/latex] | [latex]\left(2,3\right)[/latex] |
| [latex]3[/latex] | [latex]y=2\left(3\right)-1=5[/latex] | [latex]\left(3,5\right)[/latex] |
 Figure 6
How To: Given an equation, graph by plotting points.
- Make a table with one column labeled x, a second column labeled with the equation, and a third column listing the resulting ordered pairs.
- Enter x-values down the first column using positive and negative values. Selecting the x-values in numerical order will make the graphing simpler.
- Select x-values that will yield y-values with little effort, preferably ones that can be calculated mentally.
- Plot the ordered pairs.
- Connect the points if they form a line.
Example 2: Graphing an Equation in Two Variables by Plotting Points
Graph the equation [latex]y=-x+2[/latex] by plotting points.Solution
First, we construct a table similar to the one below. Choose x values and calculate y.| [latex]x[/latex] | [latex]y=-x+2[/latex] | [latex]\left(x,y\right)[/latex] |
| [latex]-5[/latex] | [latex]y=-\left(-5\right)+2=7[/latex] | [latex]\left(-5,7\right)[/latex] |
| [latex]-3[/latex] | [latex]y=-\left(-3\right)+2=5[/latex] | [latex]\left(-3,5\right)[/latex] |
| [latex]-1[/latex] | [latex]y=-\left(-1\right)+2=3[/latex] | [latex]\left(-1,3\right)[/latex] |
| [latex]0[/latex] | [latex]y=-\left(0\right)+2=2[/latex] | [latex]\left(0,2\right)[/latex] |
| [latex]1[/latex] | [latex]y=-\left(1\right)+2=1[/latex] | [latex]\left(1,1\right)[/latex] |
| [latex]3[/latex] | [latex]y=-\left(3\right)+2=-1[/latex] | [latex]\left(3,-1\right)[/latex] |
| [latex]5[/latex] | [latex]y=-\left(5\right)+2=-3[/latex] | [latex]\left(5,-3\right)[/latex] |
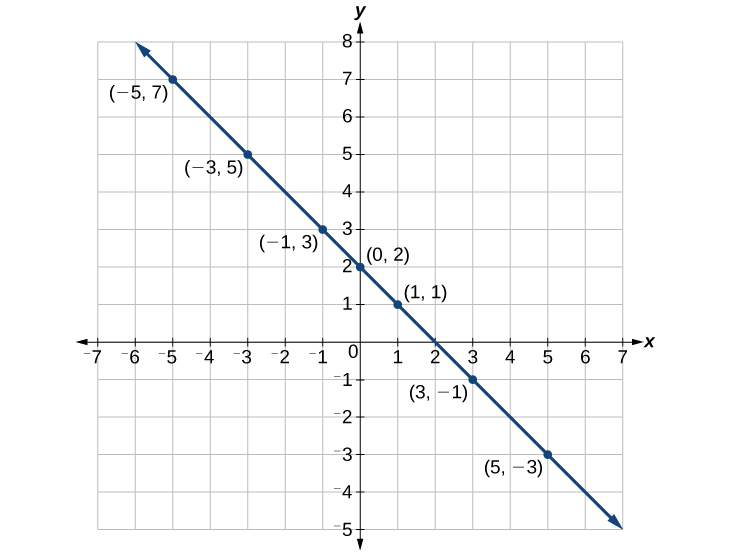 Figure 7
Construct a table and graph the equation by plotting points: [latex]y=\frac{1}{2}x+2[/latex].
| [latex]x[/latex] | [latex]y=\frac{1}{2}x+2[/latex] | [latex]\left(x,y\right)[/latex] |
| [latex]-2[/latex] | [latex]y=\frac{1}{2}\left(-2\right)+2=1[/latex] | [latex]\left(-2,1\right)[/latex] |
| [latex]-1[/latex] | [latex]y=\frac{1}{2}\left(-1\right)+2=\frac{3}{2}[/latex] | [latex]\left(-1,\frac{3}{2}\right)[/latex] |
| [latex]0[/latex] | [latex]y=\frac{1}{2}\left(0\right)+2=2[/latex] | [latex]\left(0,2\right)[/latex] |
| [latex]1[/latex] | [latex]y=\frac{1}{2}\left(1\right)+2=\frac{5}{2}[/latex] | [latex]\left(1,\frac{5}{2}\right)[/latex] |
| [latex]2[/latex] | [latex]y=\frac{1}{2}\left(2\right)+2=3[/latex] | [latex]\left(2,3\right)[/latex] |
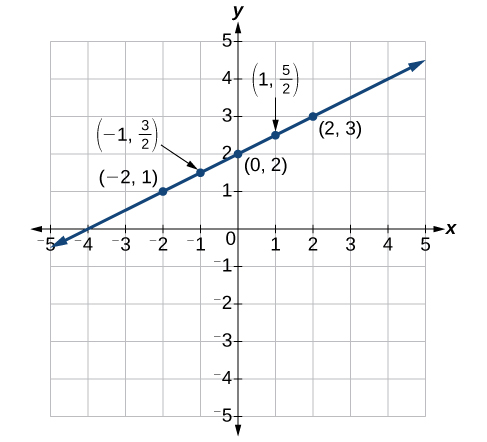 Figure 8
Licenses & Attributions
CC licensed content, Specific attribution
- College Algebra. Provided by: OpenStax Authored by: OpenStax College Algebra. Located at: https://cnx.org/contents/[email protected]:1/Preface. License: CC BY: Attribution.
