Plotting Ordered Pairs in the Cartesian Coordinate System
An old story describes how seventeenth-century philosopher/mathematician René Descartes invented the system that has become the foundation of algebra while sick in bed. According to the story, Descartes was staring at a fly crawling on the ceiling when he realized that he could describe the fly’s location in relation to the perpendicular lines formed by the adjacent walls of his room. He viewed the perpendicular lines as horizontal and vertical axes. Further, by dividing each axis into equal unit lengths, Descartes saw that it was possible to locate any object in a two-dimensional plane using just two numbers—the displacement from the horizontal axis and the displacement from the vertical axis. While there is evidence that ideas similar to Descartes’ grid system existed centuries earlier, it was Descartes who introduced the components that comprise the Cartesian coordinate system, a grid system having perpendicular axes. Descartes named the horizontal axis the x-axis and the vertical axis the y-axis. The Cartesian coordinate system, also called the rectangular coordinate system, is based on a two-dimensional plane consisting of the x-axis and the y-axis. Perpendicular to each other, the axes divide the plane into four sections. Each section is called a quadrant; the quadrants are numbered counterclockwise as shown in Figure 2.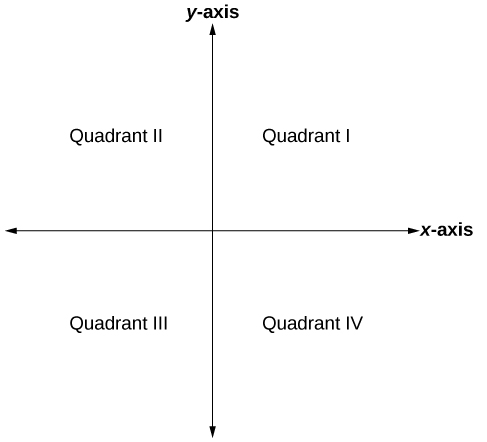 Figure 2
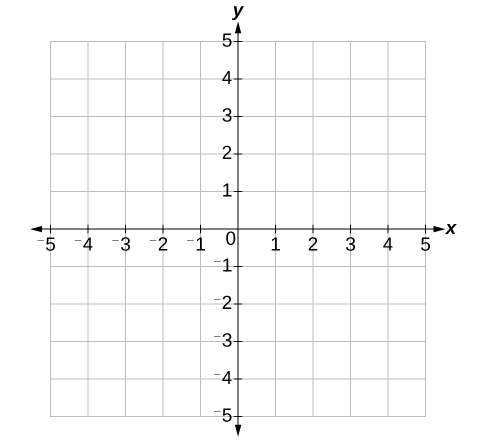 Figure 3
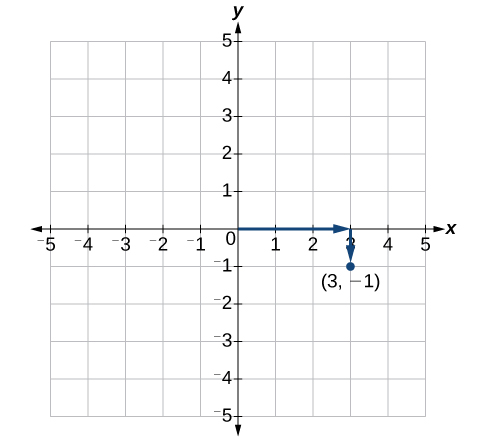 Figure 4
A General Note: Cartesian Coordinate System
A two-dimensional plane where the- x-axis is the horizontal axis
- y-axis is the vertical axis
Example 1: Plotting Points in a Rectangular Coordinate System
Plot the points [latex]\left(-2,4\right)[/latex], [latex]\left(3,3\right)[/latex], and [latex]\left(0,-3\right)[/latex] in the plane.Solution
To plot the point [latex]\left(-2,4\right)[/latex], begin at the origin. The x-coordinate is –2, so move two units to the left. The y-coordinate is 4, so then move four units up in the positive y direction. To plot the point [latex]\left(3,3\right)[/latex], begin again at the origin. The x-coordinate is 3, so move three units to the right. The y-coordinate is also 3, so move three units up in the positive y direction. To plot the point [latex]\left(0,-3\right)[/latex], begin again at the origin. The x-coordinate is 0. This tells us not to move in either direction along the x-axis. The y-coordinate is –3, so move three units down in the negative y direction. See the graph in Figure 5.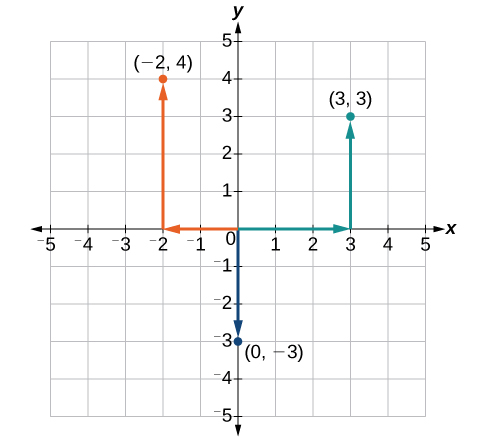 Figure 5
Analysis of the Solution
Note that when either coordinate is zero, the point must be on an axis. If the x-coordinate is zero, the point is on the y-axis. If the y-coordinate is zero, the point is on the x-axis.Licenses & Attributions
CC licensed content, Specific attribution
- College Algebra. Provided by: OpenStax Authored by: OpenStax College Algebra. Located at: https://cnx.org/contents/[email protected]:1/Preface. License: CC BY: Attribution.
