Characteristics of Rational Functions
Learning Objectives
- Use arrow notation to describe local and end behavior of rational functions
- Identify horizontal and vertical asymptotes of rational functions from graphs
- Graph a rational function given horizontal and vertical shifts
- Write a rational function that describes mixing
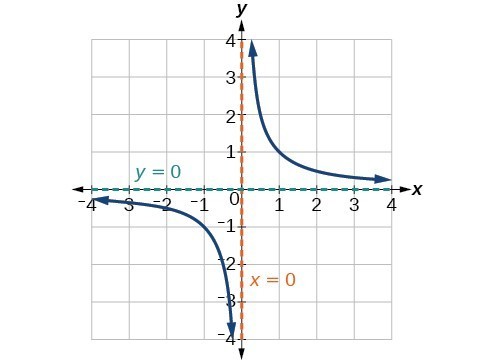
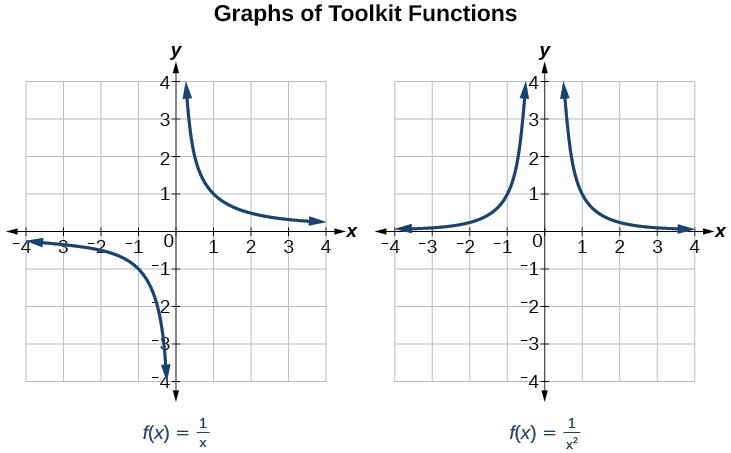 Several things are apparent if we examine the graph of [latex]f\left(x\right)=\frac{1}{x}[/latex].
- On the left branch of the graph, the curve approaches the x-axis [latex]\left(y=0\right) \text{ as } x\to -\infty [/latex].
- As the graph approaches [latex]x=0[/latex] from the left, the curve drops, but as we approach zero from the right, the curve rises.
- Finally, on the right branch of the graph, the curves approaches the x-axis [latex]\left(y=0\right) \text{ as } x\to \infty [/latex].
| Arrow Notation | |
|---|---|
| Symbol | Meaning |
| [latex]x\to {a}^{-}[/latex] | x approaches a from the left (x < a but close to a) |
| [latex]x\to {a}^{+}[/latex] | x approaches a from the right (x > a but close to a) |
| [latex]x\to \infty[/latex] | x approaches infinity (x increases without bound) |
| [latex]x\to -\infty [/latex] | x approaches negative infinity (x decreases without bound) |
| [latex]f\left(x\right)\to \infty [/latex] | the output approaches infinity (the output increases without bound) |
| [latex]f\left(x\right)\to -\infty [/latex] | the output approaches negative infinity (the output decreases without bound) |
| [latex]f\left(x\right)\to a[/latex] | the output approaches a |
Local Behavior of [latex]f\left(x\right)=\frac{1}{x}[/latex]
Let’s begin by looking at the reciprocal function, [latex]f\left(x\right)=\frac{1}{x}[/latex]. We cannot divide by zero, which means the function is undefined at [latex]x=0[/latex]; so zero is not in the domain. As the input values approach zero from the left side (becoming very small, negative values), the function values decrease without bound (in other words, they approach negative infinity). We can see this behavior in the table below.| x | –0.1 | –0.01 | –0.001 | –0.0001 |
| [latex]f\left(x\right)=\frac{1}{x}[/latex] | –10 | –100 | –1000 | –10,000 |
[latex]\text{as }x\to {0}^{-},f\left(x\right)\to -\infty [/latex]
As the input values approach zero from the right side (becoming very small, positive values), the function values increase without bound (approaching infinity). We can see this behavior in the table below.| x | 0.1 | 0.01 | 0.001 | 0.0001 |
| [latex]f\left(x\right)=\frac{1}{x}[/latex] | 10 | 100 | 1000 | 10,000 |
[latex]\text{As }x\to {0}^{+}, f\left(x\right)\to \infty [/latex].
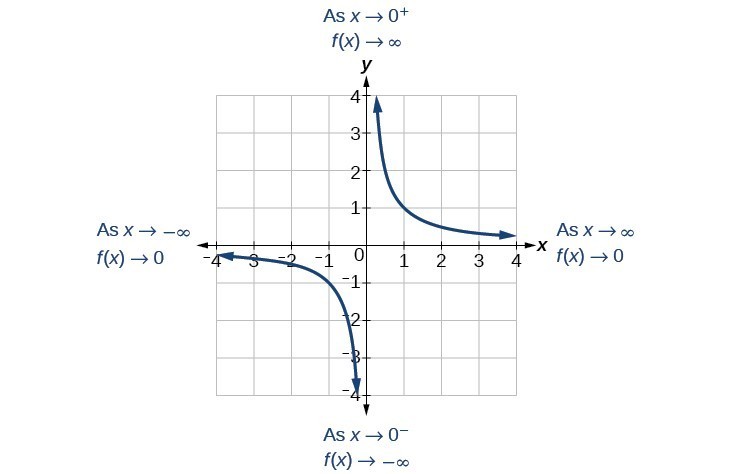 This behavior creates a vertical asymptote, which is a vertical line that the graph approaches but never crosses. In this case, the graph is approaching the vertical line x = 0 as the input becomes close to zero.
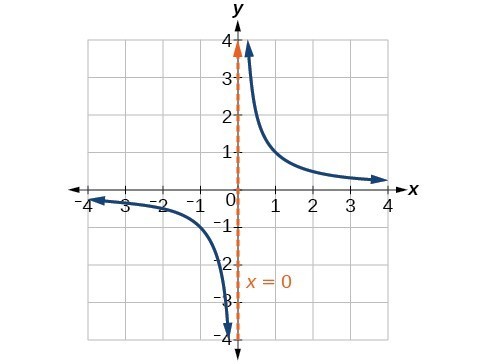
A General Note: Vertical Asymptote
A vertical asymptote of a graph is a vertical line [latex]x=a[/latex] where the graph tends toward positive or negative infinity as the inputs approach a. We write [latex]\text{As }x\to a,f\left(x\right)\to \infty , \text{or as }x\to a,f\left(x\right)\to -\infty [/latex].End Behavior of [latex]f\left(x\right)=\frac{1}{x}[/latex]
As the values of x approach infinity, the function values approach 0. As the values of x approach negative infinity, the function values approach 0. Symbolically, using arrow notation[latex]\text{As }x\to \infty ,f\left(x\right)\to 0,\text{and as }x\to -\infty ,f\left(x\right)\to 0[/latex].
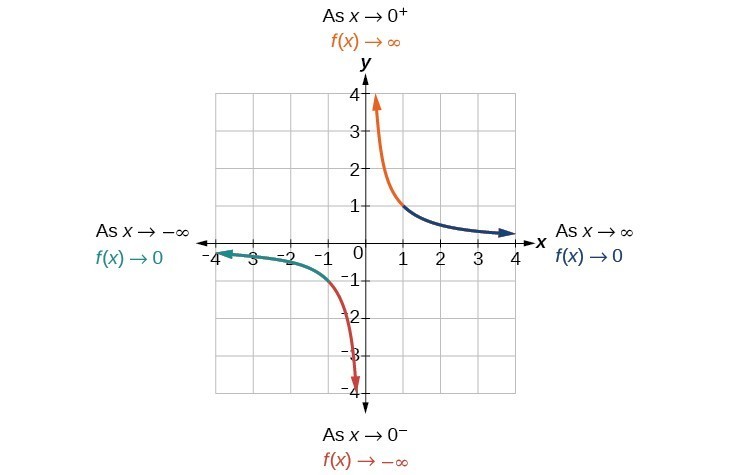 Based on this overall behavior and the graph, we can see that the function approaches 0 but never actually reaches 0; it seems to level off as the inputs become large. This behavior creates a horizontal asymptote, a horizontal line that the graph approaches as the input increases or decreases without bound. In this case, the graph is approaching the horizontal line [latex]y=0[/latex].
A General Note: Horizontal Asymptote
A horizontal asymptote of a graph is a horizontal line [latex]y=b[/latex] where the graph approaches the line as the inputs increase or decrease without bound. We write [latex]\text{As }x\to \infty \text{ or }x\to -\infty ,\text{ }f\left(x\right)\to b[/latex].Example: Using Arrow Notation
Use arrow notation to describe the end behavior and local behavior of the function below.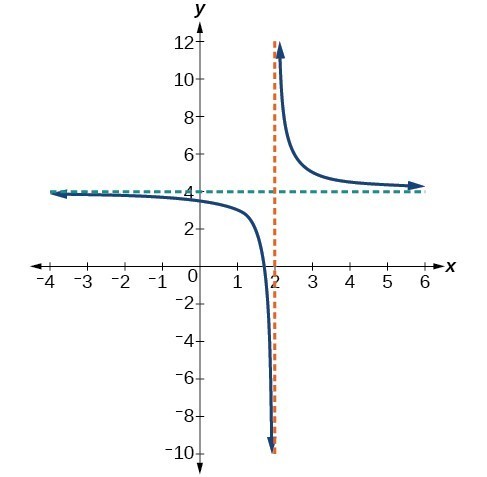
Answer: Notice that the graph is showing a vertical asymptote at [latex]x=2[/latex], which tells us that the function is undefined at [latex]x=2[/latex].
[latex]\text{As }x\to {2}^{-},f\left(x\right)\to -\infty ,\text{ and as }x\to {2}^{+},\text{ }f\left(x\right)\to \infty [/latex].
And as the inputs decrease without bound, the graph appears to be leveling off at output values of 4, indicating a horizontal asymptote at [latex]y=4[/latex]. As the inputs increase without bound, the graph levels off at 4.[latex]\text{As }x\to \infty ,\text{ }f\left(x\right)\to 4\text{ and as }x\to -\infty ,\text{ }f\left(x\right)\to 4[/latex].
Try It
Use arrow notation to describe the end behavior and local behavior for the reciprocal squared function.Answer: End behavior: as [latex]x\to \pm \infty , f\left(x\right)\to 0[/latex]; Local behavior: as [latex]x\to 0, f\left(x\right)\to \infty [/latex] (there are no x- or y-intercepts)
Licenses & Attributions
CC licensed content, Original
- Revision and Adaptation. Provided by: Lumen Learning License: CC BY: Attribution.
CC licensed content, Shared previously
- Question ID 129042, 129067. Authored by: Day, Alyson. License: CC BY: Attribution. License terms: IMathAS Community License CC-BY + GPL.
- College Algebra. Provided by: OpenStax Authored by: Abramson, Jay et al.. Located at: https://openstax.org/books/college-algebra/pages/1-introduction-to-prerequisites. License: CC BY: Attribution. License terms: Download for free at http://cnx.org/contents/[email protected].
