We've updated our
Privacy Policy effective December 15. Please read our updated Privacy Policy and tap

Study Guides > Precalculus II

Solutions for Parametric Equations: Graphs

Solutions to Try Its

1. Graph of the given parametric equations with the restricted domain - it looks like the right half of an upward opening parabola. 2. Graph of the given equations - a horizontal ellipse. 3. The graph of the parametric equations is in red and the graph of the rectangular equation is drawn in blue dots on top of the parametric equations.Overlayed graph of the two versions of the ellipse, showing that they are the same whether they are given in parametric or rectangular coordinates.
Solutions to Odd-Numbered Exercises

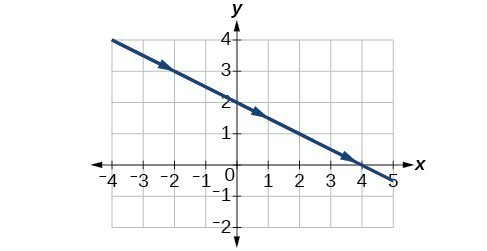
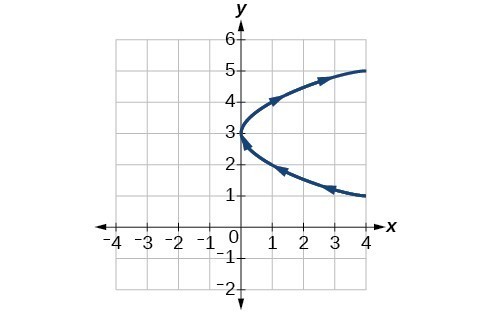
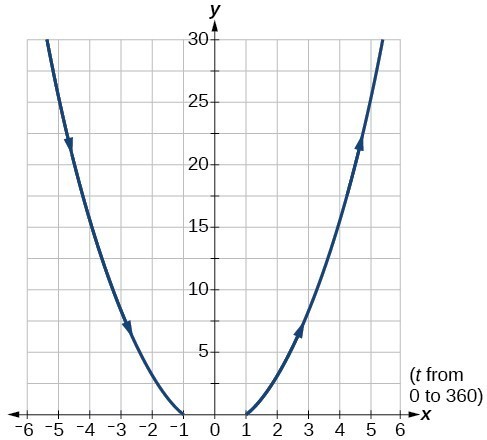
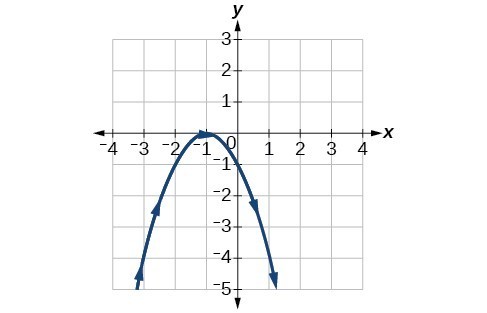
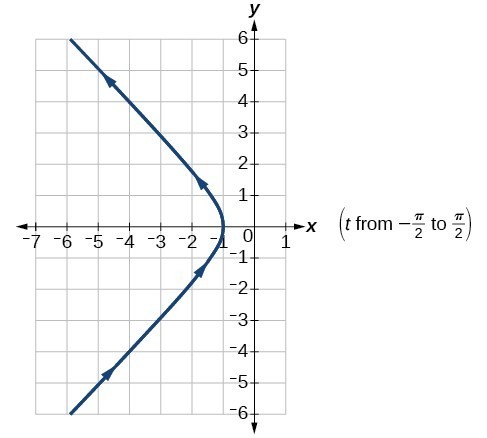
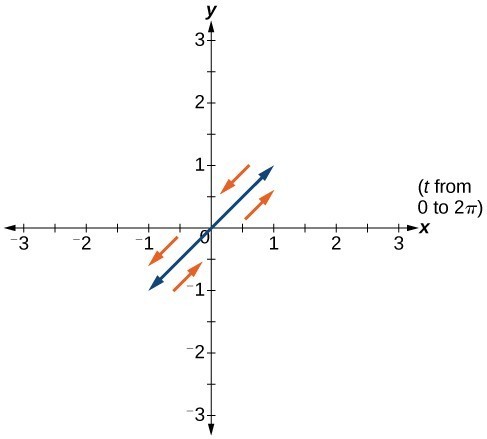
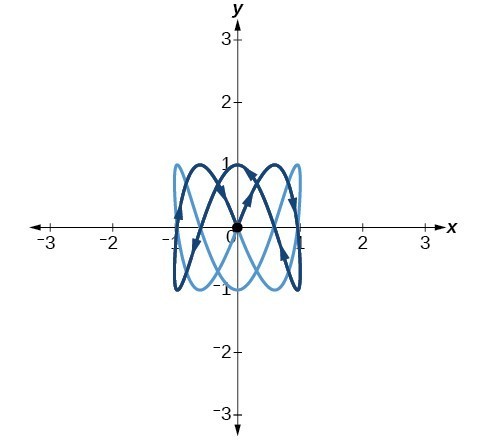
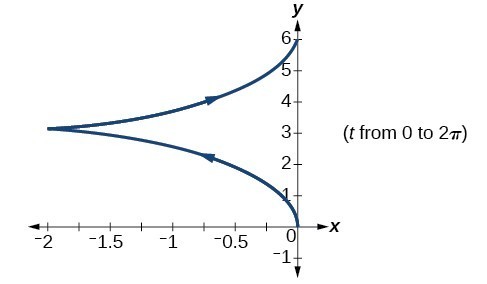
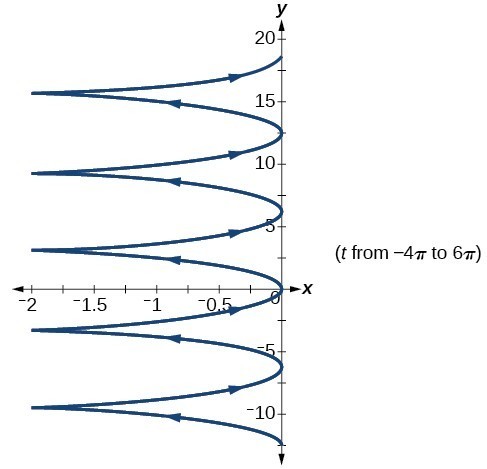
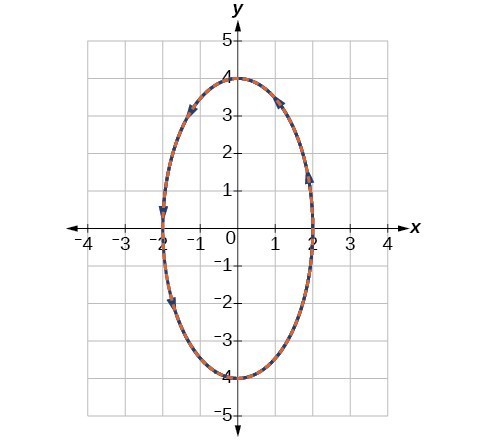
1. plotting points with the orientation arrow and a graphing calculator 3. The arrows show the orientation, the direction of motion according to increasing values of [latex]t[/latex]. 5. The parametric equations show the different vertical and horizontal motions over time. 7. Graph of the given equations - looks like an upward opening parabola. 9. Graph of the given equations - a line, negative slope. 11. Graph of the given equations - looks like a sideways parabola, opening to the right. 13. Graph of the given equations - looks like the left half of an upward opening parabola. 15. Graph of the given equations - looks like a downward opening absolute value function. 17. Graph of the given equations - a vertical ellipse. 19. Graph of the given equations- line from (0, -3) to (3,0). It is traversed in both directions, positive and negative slope. 21. Graph of the given equations- looks like an upward opening parabola. 23. Graph of the given equations- looks like a downward opening parabola. 25. Graph of the given equations- horizontal ellipse. 27. Graph of the given equations- looks like the lower half of a sideways parabola opening to the right 29. Graph of the given equations- looks like an upwards opening parabola 31. Graph of the given equations- looks like the upper half of a sideways parabola opening to the left 33. Graph of the given equations- the left half of a hyperbola with diagonal asymptotes 35. Graph of the given equations - vertical periodic trajectory 37. Graph of the given equations - vertical periodic trajectory 39. There will be 100 back-and-forth motions. 41. Take the opposite of the [latex]x\left(t\right)[/latex] equation. 43. The parabola opens up. 45. [latex]\begin{cases}x\left(t\right)=5\cos t\\ y\left(t\right)=5\sin t\end{cases}[/latex] 47. Graph of the given equations 49. Graph of the given equations - lines extending into Q1 and Q3 (in both directions) from the origin to 1 unit. 51. Graph of the given equations - lines extending into Q1 and Q3 (in both directions) from the origin to 3 units. 53. [latex]a=4,b=3,c=6,d=1[/latex] 55. [latex]a=4,b=2,c=3,d=3[/latex] 57. Graph of the given equations Graph of the given equations Graph of the given equations 59. Graph of the given equations Graph of the given equations Graph of the given equations 61. The [latex]y[/latex] -intercept changes. 63. [latex]y\left(x\right)=-16{\left(\frac{x}{15}\right)}^{2}+20\left(\frac{x}{15}\right)[/latex] 65. [latex]\begin{cases}x\left(t\right)=64t\cos \left(52^\circ \right)\\ y\left(t\right)=-16{t}^{2}+64t\sin \left(52^\circ \right)\end{cases}[/latex] 67. approximately 3.2 seconds 69. 1.6 seconds 71. Graph of the given equations - a hypocycloid 73. Graph of the given equations - a four petal rose

Licenses & Attributions

CC licensed content, Specific attribution