Read: Graph Solutions to Systems of Linear Inequalities
Learning Objectives
- Solve systems of linear inequalities by graphing the solution region
- Graph solutions to a system that contains a compound inequality
Example
Shade the region of the graph that represents solutions for both inequalities. [latex]x+y\geq1[/latex] and [latex]y–x\geq5[/latex].Answer: Graph one inequality. First graph the boundary line, using a table of values, intercepts, or any other method you prefer. The boundary line for [latex]x+y\geq1[/latex] is [latex]x+y=1[/latex], or [latex]y=−x+1[/latex]. Since the equal sign is included with the greater than sign, the boundary line is solid.
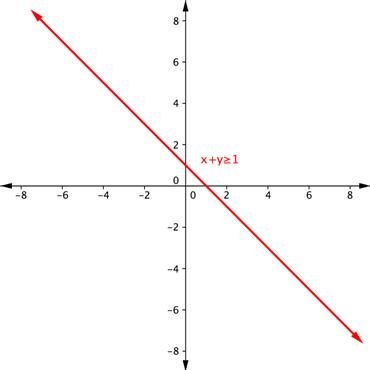 Find an ordered pair on either side of the boundary line. Insert the x- and y-values into the inequality [latex]x+y\geq1[/latex] and see which ordered pair results in a true statement.
[latex-display]\begin{array}{r}\text{Test }1:\left(−3,0\right)\\x+y\geq1\\−3+0\geq1\\−3\geq1\\\text{FALSE}\\\\\text{Test }2:\left(4,1\right)\\x+y\geq1\\4+1\geq1\\5\geq1\\\text{TRUE}\end{array}[/latex-display]
Since [latex](4, 1)[/latex] results in a true statement, the region that includes [latex](4, 1)[/latex] should be shaded.
Find an ordered pair on either side of the boundary line. Insert the x- and y-values into the inequality [latex]x+y\geq1[/latex] and see which ordered pair results in a true statement.
[latex-display]\begin{array}{r}\text{Test }1:\left(−3,0\right)\\x+y\geq1\\−3+0\geq1\\−3\geq1\\\text{FALSE}\\\\\text{Test }2:\left(4,1\right)\\x+y\geq1\\4+1\geq1\\5\geq1\\\text{TRUE}\end{array}[/latex-display]
Since [latex](4, 1)[/latex] results in a true statement, the region that includes [latex](4, 1)[/latex] should be shaded.
 Do the same with the second inequality. Graph the boundary line, then test points to find which region is the solution to the inequality. In this case, the boundary line is [latex]y–x=5\left(\text{or }y=x+5\right)[/latex] and is solid. Test point [latex](−3, 0)[/latex] is not a solution of [latex]y–x\geq5[/latex], and test point [latex](0, 6)[/latex] is a solution.

Answer
The purple region in this graph shows the set of all solutions of the system.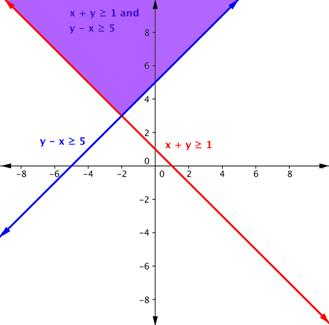
Example
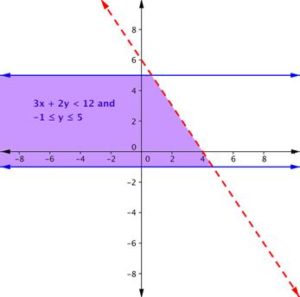
Find the solution to the system [latex] 3x + 2y < 12 [/latex] and [latex] -1 ≤ y ≤ 5 [/latex].Answer:
Graph one inequality. First graph the boundary line, then test points.
Remember, because the inequality [latex] 3x + 2y < 12 [/latex] does not include the equal sign, draw a dashed border line.
Testing a point (like [latex](0, 0)[/latex] will show that the area below the line is the solution to this inequality.
 The inequality [latex] -1 ≤ y ≤ 5[/latex] is actually two inequalities: [latex]−1 ≤ y[/latex], and [latex]y ≤ 5[/latex]. Another way to think of this is y must be between [latex]−1[/latex] and [latex]5[/latex]. The border lines for both are horizontal. The region between those two lines contains the solutions of [latex] -1 ≤ y ≤ 5 [/latex]. We make the lines solid because we also want to include [latex]y = −1 [/latex] and [latex] y = 5[/latex].
Graph this region on the same axes as the other inequality.
The inequality [latex] -1 ≤ y ≤ 5[/latex] is actually two inequalities: [latex]−1 ≤ y[/latex], and [latex]y ≤ 5[/latex]. Another way to think of this is y must be between [latex]−1[/latex] and [latex]5[/latex]. The border lines for both are horizontal. The region between those two lines contains the solutions of [latex] -1 ≤ y ≤ 5 [/latex]. We make the lines solid because we also want to include [latex]y = −1 [/latex] and [latex] y = 5[/latex].
Graph this region on the same axes as the other inequality.
 The purple region in this graph shows the set of all solutions of the system.
Answer
Licenses & Attributions
CC licensed content, Original
- Ex 1: Graph a System of Linear Inequalities. Authored by: James Sousa (Mathispower4u.com) . License: CC BY: Attribution.
CC licensed content, Shared previously
- Ex 2: Graph a System of Linear Inequalities. Authored by: James Sousa (Mathispower4u.com) . License: CC BY: Attribution.
- Determine the Solution to a System of Inequalities (Compound). Authored by: James Sousa (Mathispower4u.com) . License: Public Domain: No Known Copyright.
- Unit 14: Systems of Equations and Inequalities, from Developmental Math: An Open Program. Provided by: Monterey Institute of Technology Located at: https://www.nroc.org/. License: CC BY: Attribution.
